Check of ciunkos.com/korpo-tlumacz
Nov 4, 2026, 12:44 · daily
- Performance
- Accessibility
- Best Practices
- SEO
Lighthouse 13.5 (mobile, simulated throttling), median of three runs. Scores 0–100: 90 and up green, 50–89 orange, below 50 red; a dash means the category was not measured in that check.
TBT is the lab stand-in for INP, which needs real interactions.
- Performance
- 84needs improvement−11 vs previous
- LCP
- 3.0 sneeds improvement+1.5 s vs previous
- CLS
- 0good±0 vs previous
- TBT
- 427 msneeds improvement+189 ms vs previous
- FCP
- 1.2 sgood+4 ms vs previous
- TTFB
- 36 msgood+13 ms vs previous
Slower than before: LCP, TBT, Performance
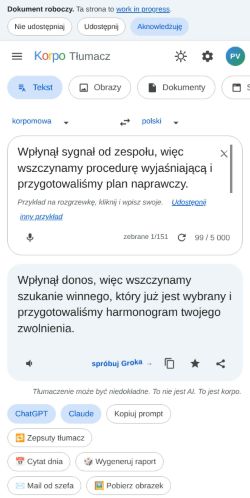
- LCP element
divWpłynął sygnał od zespołu, więc wszczynamy procedurę wyjaśniającą i przygotowal…- Page weight
- 635 KB
- Long tasks
- 6
- Conditions
- Lighthouse 13.5.0, mobile (Moto G Power emulation, 412×823), simulated throttling (150 ms RTT, 1.6 Mbps, CPU 4×), median of 3 runs, benchmarkIndex 1923
Loads
| Load | Perf | LCP | FCP | TBT | CLS | TTFB |
|---|---|---|---|---|---|---|
| 1 | 87 | 1.4 s | 1.3 s | 494 ms | 0 | 539 ms |
| 2 | 81 | 3.0 s | 1.2 s | 506 ms | 0 | 47 ms |
| 3 | 84 | 3.0 s | 1.2 s | 427 ms | 0 | 36 ms |
What failed
Performance 84
- Total Blocking Time
total-blocking-time430 ms - Largest Contentful Paint
largest-contentful-paint3.0 s - Forced reflow
forced-reflow-insighthttps://ciunkos.com/korpo-tlumacz/index.js?v=8a53c061f1https://ciunkos.com/korpo-tlumacz/index.js?v=8a53c061f1https://ciunkos.com/korpo-tlumacz/index.js?v=8a53c061f1 - Network dependency tree
network-dependency-tree-insightpreconnect hints help the browser establish a connection earlier in the page loAdd preconnect hints to your most important origins, but try to use no more tha - Minify CSS
unminified-cssEst savings of 13 KiBhttps://ciunkos.com/korpo-tlumacz/index.css?v=8a53c061f1 - Minify JavaScript
unminified-javascriptEst savings of 187 KiBhttps://ciunkos.com/korpo-tlumacz/lexicon.js?v=8a53c061f1https://ciunkos.com/korpo-tlumacz/index.js?v=8a53c061f1https://ciunkos.com/korpo-tlumacz/ai-bielik.js?v=8a53c061f1 - Reduce unused CSS
unused-css-rulesEst savings of 19 KiBhttps://ciunkos.com/korpo-tlumacz/index.css?v=8a53c061f1 - Minimize main-thread work
mainthread-work-breakdown2.3 s - Max Potential First Input Delay
max-potential-fid390 ms - Use efficient cache lifetimes
cache-insightEst savings of 2 KiBhttps://ciunkos.com/korpo-tlumacz/ikony/obserwatoriumjezykowe.uw.edu.pl.pnghttps://ciunkos.com/korpo-tlumacz/ikony/wykop.pl.pnghttps://ciunkos.com/korpo-tlumacz/ikony/demagog.org.pl.png - Render-blocking requests
render-blocking-insightEst savings of 20 mshttps://ciunkos.com/korpo-tlumacz/index.css?v=8a53c061f1 - Reduce unused JavaScript
unused-javascriptEst savings of 95 KiBhttps://ciunkos.com/korpo-tlumacz/index.js?v=8a53c061f1https://ciunkos.com/korpo-tlumacz/slownik.js?v=8a53c061f1https://ciunkos.com/korpo-tlumacz/ai-bielik.js?v=8a53c061f1
Accessibility 100
- Elements with visible text labels do not have matching accessible names.
label-content-name-mismatchbody > header.hdr > button#btnAvatar <button class="avatar" id="btnAvatar" aria-label="Konto: Product Victim">div.panes > div.pane > div.pbar > button#modelCta <button class="model-cta w-pasku" id="modelCta" type="button" aria-label="Spróbuj inny model">
Best Practices 100
- Missing source maps for large first-party JavaScript
valid-source-maps
SEO 100
Nothing failed in this category.
Google PageSpeed Insights: Comparison details
Vitals Desk is the primary measurement. Google adds one mobile lab run from its servers. This comparison does not change our scores, history or slowdown emails.
Substantial differences: Performance, LCP, TBT, FCP
The Lighthouse versions differ; scores and checks may not be directly comparable.
Different locations, hardware, Lighthouse versions and a single run versus our three-run median can produce different results. These are comparison notes, not regression alerts.
| Metric | Vitals Desk | Google minus Vitals Desk | |
|---|---|---|---|
| Performance | 84 | 94 | +10 |
| Accessibility | 100 | 100 | ±0 |
| Best Practices | 100 | 92 | −8 |
| SEO | 100 | 100 | ±0 |
| LCP | 3.0 s | 1.7 s | −1.3 s |
| CLS | 0 | 0.02 | +0.02 |
| TBT | 427 ms | 242 ms | −185 ms |
| FCP | 1.2 s | 1.7 s | +462 ms |
| TTFB | 36 ms | 4 ms | −32 ms |
- Lighthouse version
- 13.6.0
- Google checked at
- Nov 4, 2026, 12:44
- Google’s final URL
- https://ciunkos.com/korpo-tlumacz
Additional failed checks in Google’s sample
These appear in Google’s saved sample but not in our saved list. Each source keeps a limited list.
- Legacy JavaScript
legacy-javascript-insight(Performance) - Time to Interactive
interactive(Performance) - Browser errors were logged to the console
errors-in-console(Best Practices) - Issues were logged in the `Issues` panel in Chrome Devtools
inspector-issues(Best Practices)