Check of ciunkos.com/posthog-dashboard-generator
Nov 13, 2026, 11:55 · daily
- Performance
- Accessibility
- Best Practices
- SEO
Lighthouse 13.5 (mobile, simulated throttling), median of three runs. Scores 0–100: 90 and up green, 50–89 orange, below 50 red; a dash means the category was not measured in that check.
TBT is the lab stand-in for INP, which needs real interactions.
- Performance
- 100good±0 vs previous±0 vs 7-day median
- LCP
- 916 msgood+3 ms vs previous+3 ms vs 7-day median
- CLS
- 0good±0 vs previous±0 vs 7-day median
- TBT
- 0 msgood±0 vs previous±0 vs 7-day median
- FCP
- 916 msgood+3 ms vs previous+3 ms vs 7-day median
- TTFB
- 20 msgood−64 ms vs previous+6 ms vs 7-day median
No slowdown against the previous check and the 7-day median.
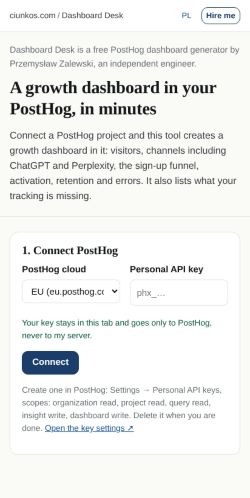
- LCP element
main#main > section.hero > div.wrap > p.leadConnect a PostHog project and this tool creates a growth dashboard in it: visit…- Page weight
- 37 KB
- Long tasks
- 1
- Conditions
- Lighthouse 13.5.0, mobile (Moto G Power emulation, 412×823), simulated throttling (150 ms RTT, 1.6 Mbps, CPU 4×), median of 3 runs, benchmarkIndex 2650
Loads
| Load | Perf | LCP | FCP | TBT | CLS | TTFB |
|---|---|---|---|---|---|---|
| 1 | 100 | 942 ms | 942 ms | 0 ms | 0 | 120 ms |
| 2 | 100 | 912 ms | 912 ms | 0 ms | 0 | 11 ms |
| 3 | 100 | 916 ms | 916 ms | 0 ms | 0 | 20 ms |
What failed
Performance 100
- Network dependency tree
network-dependency-tree-insightpreconnect hints help the browser establish a connection earlier in the page loAdd preconnect hints to your most important origins, but try to use no more tha - Use efficient cache lifetimes
cache-insightEst savings of 0 KiBhttps://ciunkos.com/posthog-dashboard-generator/a/przemo-160.webp - Render-blocking requests
render-blocking-insighthttps://ciunkos.com/posthog-dashboard-generator/a/site-footer.css?v=2026-11-10-c41b4dahttps://ciunkos.com/posthog-dashboard-generator/a/app.css?v=2026-11-10-c41b4da
Accessibility 100
Nothing failed in this category.
Best Practices 100
Nothing failed in this category.
SEO 100
Nothing failed in this category.
Google PageSpeed Insights: Comparison details
Vitals Desk is the primary measurement. Google adds one mobile lab run from its servers. This comparison does not change our scores, history or slowdown emails.
The measured values have no substantial differences.
The Lighthouse versions differ; scores and checks may not be directly comparable.
Different locations, hardware, Lighthouse versions and a single run versus our three-run median can produce different results. These are comparison notes, not regression alerts.
| Metric | Vitals Desk | Google minus Vitals Desk | |
|---|---|---|---|
| Performance | 100 | 98 | −2 |
| Accessibility | 100 | 100 | ±0 |
| Best Practices | 100 | 100 | ±0 |
| SEO | 100 | 100 | ±0 |
| LCP | 916 ms | 932 ms | +16 ms |
| CLS | 0 | 0 | ±0 |
| TBT | 0 ms | 68 ms | +68 ms |
| FCP | 916 ms | 932 ms | +16 ms |
| TTFB | 20 ms | 3 ms | −17 ms |
- Lighthouse version
- 13.6.0
- Google checked at
- Nov 13, 2026, 11:55
- Google’s final URL
- https://ciunkos.com/posthog-dashboard-generator
Additional failed checks in Google’s sample
These appear in Google’s saved sample but not in our saved list. Each source keeps a limited list.
- Speed Index
speed-index(Performance) - Legacy JavaScript
legacy-javascript-insight(Performance) - Reduce unused JavaScript
unused-javascript(Performance)