Check of ciunkos.com/posthog-dashboard-generator
Oct 23, 2026, 01:42 · daily
- Performance
- Accessibility
- Best Practices
- SEO
Lighthouse 13.5 (mobile, simulated throttling), median of three runs. Scores 0–100: 90 and up green, 50–89 orange, below 50 red; a dash means the category was not measured in that check.
TBT is the lab stand-in for INP, which needs real interactions.
- Performance
- 100good±0 vs previous
- LCP
- 913 msgood+3 ms vs previous
- CLS
- 0good±0 vs previous
- TBT
- 0 msgood±0 vs previous
- FCP
- 913 msgood+3 ms vs previous
- TTFB
- 12 msgood−1 ms vs previous
No slowdown against the previous check and the 7-day median.
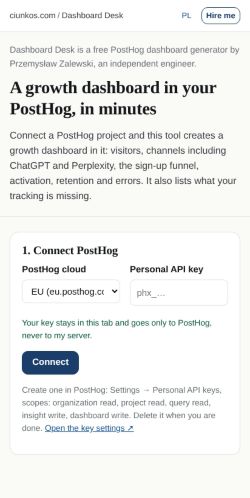
- LCP element
main#main > section.hero > div.wrap > p.leadConnect a PostHog project and this tool creates a growth dashboard in it: visit…- Page weight
- 31 KB
- Long tasks
- 1
- Conditions
- Lighthouse 13.5.0, mobile (Moto G Power emulation, 412×823), simulated throttling (150 ms RTT, 1.6 Mbps, CPU 4×), median of 3 runs, benchmarkIndex 2849
Loads
| Load | Perf | LCP | FCP | TBT | CLS | TTFB |
|---|---|---|---|---|---|---|
| 1 | 100 | 916 ms | 916 ms | 0 ms | 0 | 92 ms |
| 2 | 100 | 913 ms | 913 ms | 0 ms | 0 | 12 ms |
| 3 | 100 | 912 ms | 912 ms | 0 ms | 0 | 13 ms |
What failed
Performance 100
- Network dependency tree
network-dependency-tree-insightpreconnect hints help the browser establish a connection earlier in the page loAdd preconnect hints to your most important origins, but try to use no more tha - Use efficient cache lifetimes
cache-insightEst savings of 0 KiBhttps://ciunkos.com/posthog-dashboard-generator/a/przemo-160.webp - Render-blocking requests
render-blocking-insighthttps://ciunkos.com/posthog-dashboard-generator/a/app.css?v=2026-10-21-b3c87c8
Accessibility 100
Nothing failed in this category.
Best Practices 100
Nothing failed in this category.
SEO 100
Nothing failed in this category.